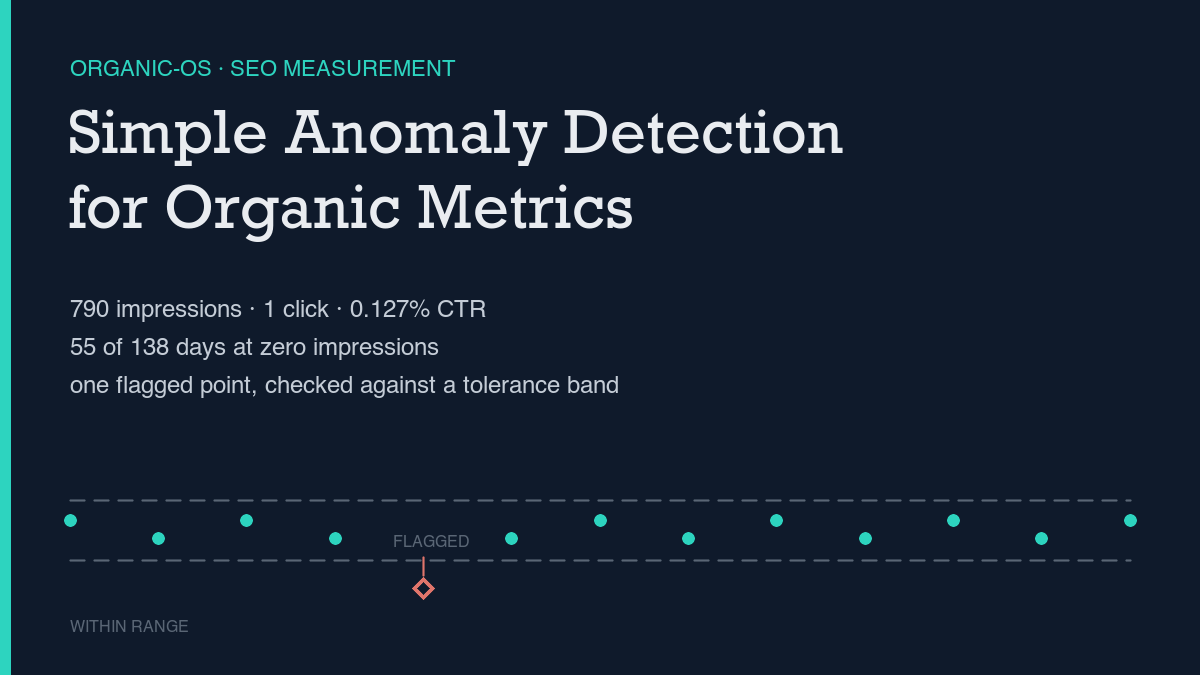
SEO anomaly detection, done simply, means comparing a short recent window of your own Search Console and Analytics data against a defined baseline window, and only calling something an anomaly if it holds for multiple days rather than reverting after one. Applied to this site’s own 138-day Search Console window, the real numbers are 790 impressions, 1 click, a 0.127% click-through rate, and 55 of 138 days — 39.9% — with zero impressions at all. The one clear anomaly in that window is a real multi-day step change in late August, not a one-day spike, and it is reported here with the same noise floor applied to every other number in this piece.
Most anomaly-detection advice stays at the level of “watch for unusual spikes or drops.” I checked the live search results for this exact topic before writing anything here, and the more specific version of that advice holds up: anomalies are deviations outside an expected band of normal variation, the common causes are sudden drops from indexing or tracking breakage and sudden spikes from bot traffic or seasonal demand, and the standard fix for telling a real anomaly from noise is cross-referencing Search Console with Analytics and defining a baseline before calling anything unusual. This piece runs that method against this site’s own numbers, including the ones that don’t flatter it.
The method, step by step
Two data pulls do the actual work. The first groups Search Console data by date across a wide window, which shows whether visibility exists at all on a given day and how it moves over time. The second groups the same window by query, which shows which specific search terms are producing impressions and whether a target keyword is showing up anywhere yet. A third pull, Analytics engagement data for a comparable period, checks whether any traffic arriving is actually engaging or just bouncing. Running all three as raw data pulled by script, rather than reading numbers off a dashboard screenshot, is the same discipline behind building an SEO dashboard from APIs, not screenshots: a number computed the same way twice is checkable, and a number eyeballed off a chart usually isn’t.
Once the three pulls are in hand, pick a baseline window before looking for anomalies, not after — picking the baseline after seeing the data is how a real pattern gets fitted to a story instead of tested against one. Then apply a short persistence test to anything that looks interesting: did the change hold for several days in a row, or was it a single-day blip? Is there a plausible cause — new content, a new link, an indexing change — or no corresponding event at all? A genuine step change holds at an elevated level across multiple consecutive days. A blip reverts immediately. That distinction is the entire method; everything else is just bookkeeping.
This site’s real numbers right now
The by-date pull covers June 1 through October 16, 2026 — 138 days, pulled site-wide rather than filtered to this specific page, since a brand-new URL has no history of its own yet. Across that window: 790 total impressions, 1 total click, and a site-wide click-through rate of 0.127%. Fifty-five of the 138 days — 39.9% of the window — show zero impressions at all, and the window opens with zero impressions straight through to July 18.
The only click anywhere in these 138 days landed on September 9: one click on five impressions, a 20% click-through rate, at an average position of 5.8. The clearest anomaly in the dataset sits a couple of weeks earlier. Across the seven days from August 19 through August 25, impressions averaged 1.14 per day. Starting August 26, that average jumped to 39.5 per day across six straight days — 34, 42, 37, 39, 51, then 34 — before settling to a lower, still-elevated level afterward. Six consecutive days above the baseline is what makes that a step change worth naming rather than a blip worth ignoring, the exact persistence test described in telling SEO signal from noise on a small site.
The by-query pull for the same window shows a gap the by-date view can’t: every single query row carries zero clicks, the single highest-impression query is “how to add canonical tag in the header of wordpress?” at 20 impressions and an average position of 18.95, and no query containing “anomaly detection” or a close variant appears anywhere in the fifty rows pulled — the keyword this exact page targets has not generated one measurable impression yet. That gap between impressions existing at all and a specific target keyword or click existing is the trap named directly in impressions but no clicks: what the data actually shows. The most recent seven days in this same pull (October 10 through 16) add up to 89 impressions and zero clicks — visibility continuing, conversion still absent.
Reading results honestly
One click in 138 days is not evidence of a trend; it is one data point with a sample size of one. Calling it “clicks are picking up” would be exactly the kind of overclaim this method exists to prevent. There is also a timing artifact worth naming: the most recent two or three days of any Search Console pull are provisional, because the data backfills and gets reclassified after the fact, a mechanism covered directly in why Search Console data lags and how to handle it. Reading a dip in the final day or two of a pull as a sudden drop would usually be reading a pull-timing artifact, not a real decline.
The Analytics cross-check adds a second, harder signal. On every sampled day in this site’s engagement data, bounce rate reads 100% and engagement rate reads 0% — not an average, every single row in the sample. That is consistent with the Search Console pattern of impressions arriving without clicks: on the dates checked, visits that do land are not converting into engaged sessions. It does not prove why; it only states what the two data sources agree on.
None of this means the numbers are too thin to use — it means the number worth reporting is a window-level aggregate, not a single day’s row read in isolation, and it means naming low-volume noise out loud instead of folding it into a cleaner-looking total. A single query sitting at one or two impressions in the 70s-to-90s position range is the kind of row SEO KPIs worth reporting (and three to drop) argues should be dropped from a report rather than included to pad it.
What would falsify the conclusion
This is a method meant to be checked again against this exact page, not a one-time read of a dashboard. The method described here is wrong for this specific page if, 60 days after it publishes, Search Console still shows zero impressions for any query containing the primary keyword terms, despite the page being indexed. That is the falsifiability condition this piece is written against, and it should be reported honestly rather than quietly dropped if it holds.
Three checks are worth running before concluding the method itself failed:
- Confirm the page is actually indexed before reading zero impressions as a failed result. A page that hasn’t been indexed yet will show zero rows for reasons that have nothing to do with anomaly detection.
- Re-pull the same date range a few days later rather than trusting the most recent rows. As this piece’s own pull shows, the last two or three days in any window are provisional until Search Console finishes backfilling them.
- Check whether any movement persisted for multiple days or reverted immediately. This site’s own late-August step change held for six straight days; a single-day spike that reverts the next day is the noise this method exists to filter out, not a signal worth reporting.
Leave a Reply