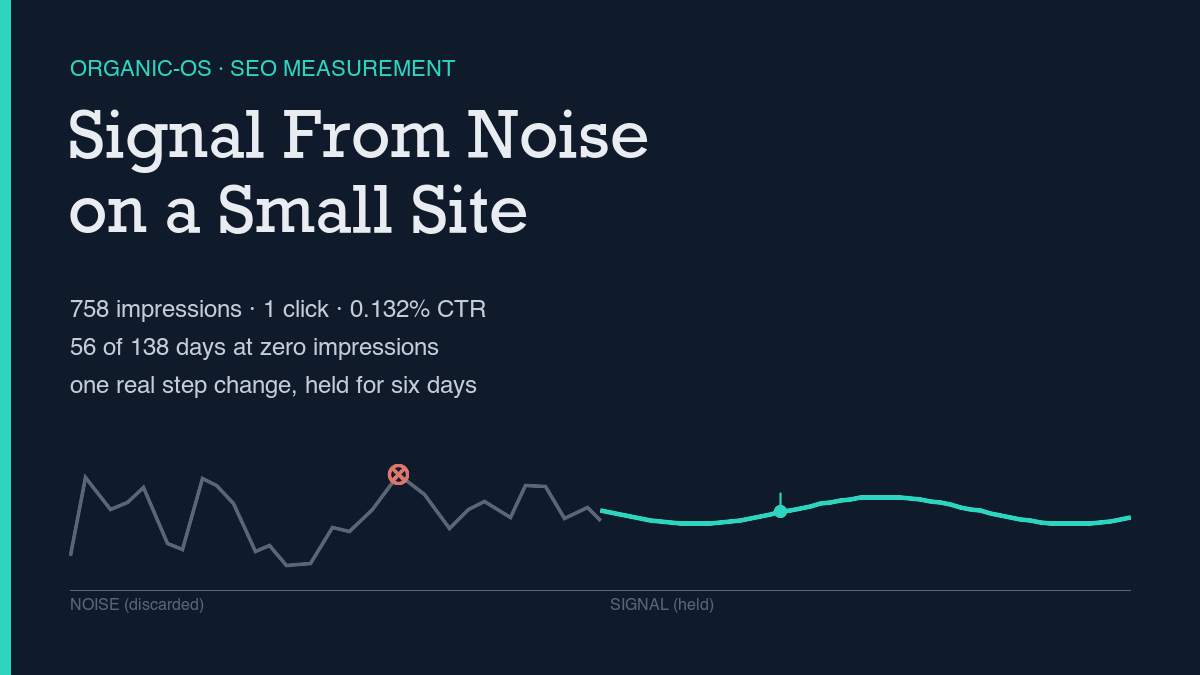
Telling SEO signal from noise on a small site comes down to a repeatable method, not a feeling about a good week: pull Search Console by date and by query, run a “so what” test on anything that looks like a spike, and only report a window-level aggregate once the data has had time to settle. Applied to this site’s own 138-day Search Console window, the honest aggregate is 758 impressions, 1 click, a 0.132% click-through rate, and 56 of 138 days — 40.6% — with zero impressions at all. That is the real floor this piece measures against, not a cherry-picked good day.
Most writing on this topic stays abstract — noise is bad, signal is good, look for patterns. I checked the live search results for “SEO data noise vs signal small site” before writing anything here, and the useful version of that advice is more specific: small sites carry amplified statistical noise because the absolute numbers are small, a single-day spike with no matching change in content or links should be treated as suspect, and the test worth applying to any metric is what decision it would change and who would act on it. This piece runs that method against this site’s own numbers, including the ones that don’t flatter it.
The method, step by step
Two pulls do the actual work, and neither one alone is enough. The first groups Search Console data by date across a wide window, which shows whether visibility exists at all on a given day and how it moves over time. The second groups the same window by query, which shows which specific search terms are producing impressions and at what position. A by-date view can look healthy while one query carries almost all of the volume, and a by-query view can’t show the day-to-day movement that makes a real step change visible. Running both as raw data pulled by script, rather than reading numbers off a dashboard screenshot, is the same discipline behind building an SEO dashboard from APIs, not screenshots: a number computed the same way twice is checkable, and a number eyeballed off a chart usually isn’t.
Once the two pulls are in hand, the actual noise-vs-signal test is a short checklist applied to anything that looks interesting: did this change persist for several days, or was it a single-day blip? Does it show up in more than one related query, or only one? Is there a plausible cause — new content, a new link, an indexing change — or no corresponding event at all? A genuine step change holds at an elevated level for multiple days in a row. A blip reverts immediately. The difference matters because treating a blip as a trend leads to reporting progress that isn’t there, and treating a real step change as noise means missing the one thing worth paying attention to.
This site’s real numbers right now
The by-date pull covers May 31 through October 15, 2026 — 138 days. Across that window: 758 total impressions, 1 total click, a site-wide click-through rate of 0.132%, and an impression-weighted average position of 36.79. Fifty-six of the 138 days — 40.6% of the window — show zero impressions at all, including a 49-day unbroken stretch from May 31 through July 18 before this site had any visibility whatsoever. That zero-impression rate is the baseline most “is my SEO working” questions should be measured against.
The first impression in the window landed on July 19 — 4 impressions, position 78.25, nowhere near a page a person would actually see. The only click anywhere in these 138 days arrived nearly two months later, on September 9: one click on five impressions at position 5.8. Between those two dates sits the clearest example of a real step change in this dataset: impressions jumped from single digits to 34 on August 26 and held at an elevated level for the following five days — 42, 37, 39, 51, then 34 — before settling lower. That six-day persistence is what separates a step change from a blip; a one-day spike that reverted the next day would have been noise, not signal.
The most recent seven days in this pull (October 9 through 15) show 66 impressions and zero clicks. Visibility is measurable; converting it into a click is a separate, harder outcome that impressions alone don’t solve, and treating impression growth as proof of success without clicks is exactly the trap described in impressions but no clicks: what the data actually shows. The by-query pull for the same general period reinforces the same caution: no query in the top 29 rows shows more than 20 impressions, most sit at 1-2 impressions in the 60s-to-90s position range, and the single highest-impression query, api seo rest, still has zero clicks at position 65.27. That’s individually meaningless noise, not a signal worth reporting on its own — the kind of number SEO KPIs worth reporting (and three to drop) argues should be dropped from a report rather than included to make a slide look fuller.
Reading results honestly
Two specific noise sources showed up in pulling this exact data, and both are worth naming rather than smoothing over. The first is timing: the most recent two or three days of any Search Console pull are provisional, because the data backfills and gets reclassified after the fact — the mechanism is covered directly in why Search Console data lags and how to handle it, and it’s the reason this piece’s own pull, requested through October 18, only actually returns complete rows through October 15. Reading that gap as a sudden drop in visibility would be a mistake; it’s a pull-timing artifact, not a decline.
The second is a mismatch between data sources that’s informative precisely because it doesn’t match. Checking this site’s GA4 engagement data over a comparable window, one day stands out sharply: July 18 shows 2 active users and 3 sessions, but 44 page views and an average session duration near 1,198 seconds — roughly four times the busiest normal day in the sample on a fraction of the traffic. That reads far more like a bot or crawler session than a real engagement event, and it is named here as a likely artifact rather than cited as evidence of anything. Reporting that number as a genuine spike would be the exact noise-trap this piece is arguing against.
None of this means the numbers are too noisy to use. It means the number worth reporting is a window-level aggregate, checked again after the data has had a few days to settle, rather than a single day’s row read in isolation — and it means naming the artifacts out loud instead of quietly folding them into a cleaner-looking total.
What would falsify the conclusion
This is a method that can be checked again, not a one-time read of a dashboard. The pre-publish baseline above shows zero queries in this site’s top 29 containing the terms “noise” or “signal” — a clean starting point. If, 60 days after this page publishes, it still shows zero Search Console impressions for any query containing those terms, despite being indexed, the method described here didn’t produce a result for this specific page, and that outcome should be reported rather than quietly dropped.
Three checks are worth running before concluding the method itself failed:
- Confirm the page is indexed before reading zero impressions as a failed result. A page that isn’t indexed yet will show zero rows for reasons that have nothing to do with noise or signal.
- Re-pull the same date range a few days later rather than trusting the most recent rows. As this piece’s own pull shows, the last two or three days in any window are provisional until Search Console finishes backfilling them.
- Check whether any movement persisted for multiple days or reverted immediately. This site’s own August step change held for six days; a single-day spike that reverts the next day is the noise this method exists to filter out.
Leave a Reply